When a polynomial is written in expanded form and in order of decreasing exponents, the first term is called the leading term. The first term’s coefficient is called the leading coefficient.
What you probably discovered in Try This 1 is that when graphing a polynomial function written in expanded form, the end behaviour is completely determined by the degree of the polynomial and the sign of the leading coefficient.
- When the degree of the polynomial is odd, the graph will begin and end in quadrants on different sides of the x-axis.
- When the degree of the polynomial is even, the graph will begin and end in quadrants on the same side of the x-axis.
- The sign of the leading coefficient determines where the graph will begin.
As you read through the examples in the table, pay special attention to how the sign of the leading coefficient determines where the graph begins.
| Polynomial Degree | Sign of Leading Coefficient | End Behaviour | Example | |
| Starting Quadrant | Ending Quadrant | |||
| odd | positive | 3 | 1 |
|
| odd | negative | 2 | 4 |
|
| even | positive | 2 | 1 | 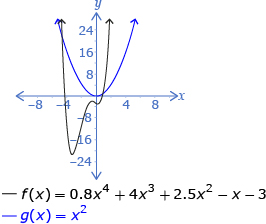 |
| even | negative | 3 | 4 | 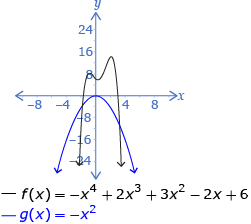 |
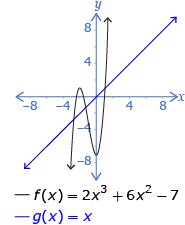
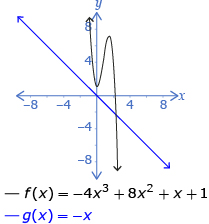
The end behaviour of all odd-degree polynomial functions is the same as y = x or y = −x. Since the graphs of y = x and y = −x are easy to remember, so is the end behaviour of all odd functions.
The end behaviour of all even-degree polynomial functions is the same as y = x2 or y = −x2. Since the graphs of y = x2 and y = −x2 are easy to remember, so is the end behaviour of all even functions.
You may want to use End Behaviour Explorer again to confirm these patterns.
Self-Check 2
Use your knowledge of polynomial function end behaviour to answer the following questions. You should be able to answer all of the questions without actually graphing the functions.
- Use the degree and the sign of the leading coefficient of each function to describe the end behaviour of the corresponding functions. State the value of the y-intercept.2
- Use the degree and the sign of the leading coefficient of each function to describe the end behaviour of the corresponding functions. State the value of the y-intercept.
2 Source: Pre-Calculus 12. Whitby, ON: McGraw-Hill Ryerson, 2011. Reproduced with permission.