Read “Example 1” on page 349 of the textbook. Notice how, in the example, each point is transformed first by the vertical stretch and then by the horizontal translation using a table.
You have graphed a given function using transformations. Can you write a function if given a graph? In Try This 5 you will look at an example of how bacteria growth can be modelled using an exponential function.

Wavebreak Media/Thinkstock
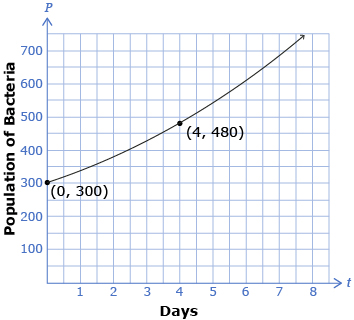
A scientist grew a type of bacteria in a Petri dish and started with 300 bacteria. The scientist found that the bacteria increased in population at an exponential rate of 60% every 4 d.
Answer the following questions to determine the exponential function for this situation in the form P = a(c)bt, where the population, P, is a function of the bacteria over time, t, in days. A graph of this situation is shown.
![]() Save your responses in your course folder.
Save your responses in your course folder.