Module 6: Lesson 1
Self-Check 3
-
Question 8 on page 367 of the textbook
- The a-value is 190. This means that there has been a vertical stretch by a factor of 190 about the x-axis. The b-value is
 . This means that there has been a horizontal stretch by a factor of 10 about the y-axis.
 - The transformed graph is as follows:
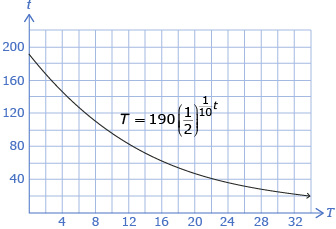
- The domain of the graph is {t|t ≥ 0, t ∈ R}. The range of the graph is {T|0 < T ≤ 190, T ∈ R}.
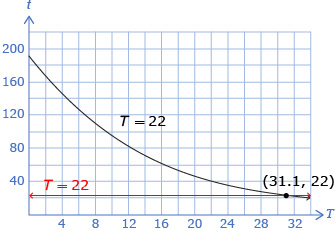
- As shown in the following graph, the milk will keep fresh for approximately 31.1 h at 22°C.
- The a-value is 190. This means that there has been a vertical stretch by a factor of 190 about the x-axis. The b-value is
© 2012 Alberta Education