Module 6: Lesson 1
Self-Check 3
-
“Your Turn” from “Example 1” on page 351 of the textbook
The transformed graph looks as follows:
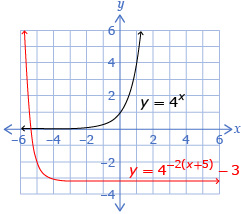
The graph has undergone the following transformations:- Because a = 1, there has been no vertical stretch nor has there been a reflection in the x-axis.
- Because b = −2, there has been a horizontal stretch by a factor of
 about the y-axis and a reflection in the y-axis.
 - Because h = −5, there has been a horizontal translation of 5 units to the left.
- Because k = −3, there has been a vertical translation of 3 units down.
y = 4x
y = 4−2x
y = 4−2(x+5)
y = 4−2(x+5)−3


(0, 1)
(0, 1)
(−5, 1)
(−5, −2)
(1, 4)


(2, 16)
(−1, 16)
(−6, 16)
(−6, 13)
The domain in the original graph was {x|x ∈ R}. There has been no change to the domain.
The range in the original graph was {y|y > 0, y ∈ R}. The vertical translation has the effect of shifting the entire range down 3 units. Thus, the new domain is: {y|y > −3, y ∈ R}.
The horizontal asymptote in the original graph was y = 0. Like for the range, the vertical translation has the effect of shifting the horizontal asymptote down 3 units. Thus, the new horizontal asymptote is y = −3.
The original graph had no x-intercept. Because of the vertical translation, there is now an x-intercept (one that can be calculated by letting y = 0 in the transformed equation). The new x-intercept occurs at approximately (−5.4, 0).
The original graph had a y-intercept of (0, 1). Because of the horizontal translation, the reflection in the y-axis, and the vertical translation, there is a new y-intercept (one that can be calculated by letting x = 0 in the transformed equation). The new x-intercept occurs at approximately (0, −2.999 99). Note that it is not (0, −3) because that is the horizontal asymptote, but it is close to that value.
© 2012 Alberta Education