iStockphoto/Thinkstock
The gravitational pull of the Sun and the Moon are the main cause of coastal tides (water levels changing regularly). When the Sun and Moon are on the same side of Earth or are opposite each other, tides tend to be larger and follow a pattern like the one seen in Vancouver from October 7 to 11, 2011.
When the Sun and Moon are not on the same side of Earth or are not across from one another, the tide can be thought of as two overlapping patterns like that seen in Vancouver from November 16 to 20, 2011.
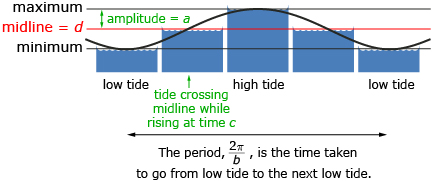
You may have noticed in Try This 2 that it is possible to represent data using an equation of the form ![]() Typically, a, b, c, and d represent some characteristic of the graph. For the tide graph,
Typically, a, b, c, and d represent some characteristic of the graph. For the tide graph,
- a = amplitude, and is half the distance between the highest water level and the lowest water level
 where P is the period or length of time it takes for the water to go from one low tide to the next low tide
- c = the phase shift and is a time when the tide hits the midline while rising, if a is positive
- d = the midline and represents the height halfway between the maximum and minimum water depths

You may have also noticed that it is possible to make predictions about tide heights in the future using your model. However, long-term predictions are not likely to be accurate because the shape of the graph changes over time.