Module 5: Lesson 2
Self-Check 1
Questions 2, 6.a., 6.d., 13, and 15 on pages 275 to 278 of the textbook
-
- x ≈ 1.3, 4.5
- x ≈ −3, −1.9, 0.1, 1.2, 3.2, 4.1, 6.3, 7.2
-
- Domain: {t|t ≥ 0, t ∈ R}
Range: {P|2000 ≤ P ≤ 14 000, P ∈ N} (Note that the population needs to be in the Natural Number System because you cannot have decimal values for people.)
- Domain: {t|t ≥ 0, t ∈ R}
Range: {h|5 ≤ h ≤ 23, h ∈ R}
- Domain: {t|t ≥ 0, t ∈ R}
-
- This answer can be solved both algebraically and graphically, although at this point it is likely that students will solve the question graphically. A possible sketch of the graph is shown, using a domain of {t|0 ≤ t ≤ 24, t ∈ R}.
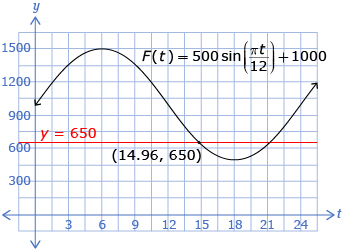
The population will drop below 650 after about 15 months. 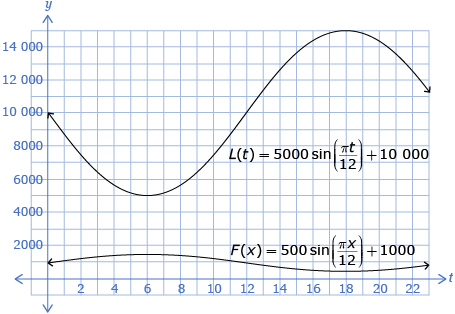
The maximum fox population is 1500, occurring in the 6th month; the minimum fox population is 500, occurring in the 18th month. The maximum population of lemmings is 15 000, occurring in the 18th month; the minimum population of lemmings is 5000, occurring in the 6th month.- The maximum population for the foxes occurs when the population for the lemmings is at a minimum, and vice versa. This appears to follow a typical predator-prey cycle found in many instances in the wild. The population of the predator is directly dependent upon the availability of the prey; as a result, it makes sense that the two populations are directly tied to each other.
- This answer can be solved both algebraically and graphically, although at this point it is likely that students will solve the question graphically. A possible sketch of the graph is shown, using a domain of {t|0 ≤ t ≤ 24, t ∈ R}.
-
- The maximum height above the horizon is 7.5 Sun widths; the minimum height above the horizon is 1 Sun width.
- The period is 24 h.
- Because the period is 24 h, you know that the b value is

The amplitude is This means that the amplitude is
The graph appears to be a sinusoidal graph that has been reflected about the x-axis; this means that you can state that the a value is −3.25. If this reflection is used, there will be no phase shift.
The vertical displacement is or
or 
With this knowledge, you can state that a sinusoidal equation that models the midnight Sun is where y represents the number of Sun widths and x represents the time in hours.
© 2012 Alberta Education