Module 1—Motion
 Lesson 4 Lab: Area and Position-Time, Velocity-Time, and Acceleration-Time Graphs

© Anne Kitzman/shutterstock
Now you will explore the idea that area is a measure of the total or cumulative change in some variable. The variables will include position, velocity, and acceleration. In this case, you will base your data analysis on an object that falls under the influence of gravity, such as the apple that may or may not have landed on Newton's head.
The simulation used for this lab lets you specify motions and construct position-time, velocity-time, and acceleration-time graphs. You can learn more about the simulation by reading the Show Me found at the top of the simulation screen.
Problem
How are position-time, velocity-time, and acceleration-time graphs related by area?
Open the 1D Non-Uniform Motion Builder Graphing (pos, vel, acc) simulation. Adjust the screen as you have done previously, if needed. Then continue with the procedure.
Procedure
Use the simulation to generate an acceleration-time graph for an apple falling from rest (v = 0.0 m/s) for 5.0 s.
Step 1: Clear all objects by selecting them and clicking “Remove” (![]() ).
).
Step 2: Click “Reset” (![]() ) and then “Add” (
) and then “Add” (![]() ) to add an object.
) to add an object.
Step 3: In the “MotionStep EditorDialog” window, enter a time of 5.0 s, an initial velocity of 0.0 m/s, and an acceleration of –9.81 m/s2. Click “OK.”
Step 4: Click “Play” (![]() ), and watch the moving object (
), and watch the moving object (![]() ) accelerate.
) accelerate.
Step 5: Generate an acceleration-time graph by first clicking on the “Graph” button (![]() ). This will open the Motion Grapher. Set the horizontal axis to time. (Remember to click the down arrow, move the slider up, and click “Time”.) Set the vertical axis to accelerator “ax0”(
). This will open the Motion Grapher. Set the horizontal axis to time. (Remember to click the down arrow, move the slider up, and click “Time”.) Set the vertical axis to accelerator “ax0”(![]() ). Finally, click “Fit Graph to the Screen” (
). Finally, click “Fit Graph to the Screen” (![]() ).
).
Step 6: Verify that your graph is similar to the following acceleration-time graph. Note how the graph line is below the 0.0 axis line because it is a negative acceleration.
Observation and Analysis
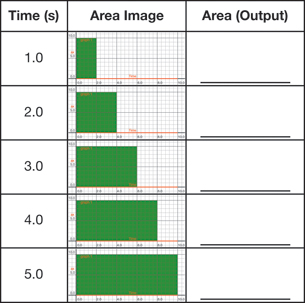
LAB 7. Using the “Integrate the Selected Graph” tool, ![]() sweep out the area from left to right between t = 0.0 s and each of the following times to complete the table.
sweep out the area from left to right between t = 0.0 s and each of the following times to complete the table.
 Module 1: Lesson 4 Assignment
Remember to submit the answer to LAB 8 to your teacher as part of your Module 1: Lesson 4 Assignment.
LAB 8. Each of the measured areas is a rectangle. You will recall that the area of a rectangle is calculated as length × height.
-
What are the units of length for each rectangle?
-
What are the units of height for each rectangle?
-
Multiply the units of length and height to determine the units of area for each rectangle. What variable is the area describing?
LAB 9. Using the simulation, create a velocity-time graph for the falling apple described in the procedure by doing the following:
- Change “Vert. Axis” to show velocity (“vx0”).
- Click “Fit Graph to the Screen.”

Verify that your graph is similar to the velocity-time graph shown.
LAB 10. Using the “Integrate the Selected Graph” tool, (![]() ), sweep out the area from left to right between t = 0.0 s and each of the following times to complete the table.
), sweep out the area from left to right between t = 0.0 s and each of the following times to complete the table.
Module 1: Lesson 4 Assignment
Remember to submit the answers to LAB 11 and LAB 12 to your teacher as part of your Module 1: Lesson 4 Assignment.
LAB 11. Each measured area is a triangle. The calculation of the area of a triangle is ½ length × height.
-
What are the units of length for each triangle?
-
What are the units of height for each triangle?
-
Multiply the units of the length (s) by the unit of height (m/s). What variable is the area describing?
LAB 12.
-
Plot the data collected in LAB 10.
-
Explain what this graph shows.
-
Why are all of the positions negative?
Lab Summary
How are position-time, velocity-time, and acceleration-time graphs related by area?
The area of an acceleration-time graph describes velocity.
The area of a velocity-time graph describes displacement.
 Read
Read
Read “Analyzing Velocity-time Graphs” on pages 31 to 35 of the textbook to see how the concepts you have just learned are used to solve problems. As you read, cover up the solution and record how you would solve the problem. Then check your answer and method with the solution presented.
 Self-Check
SC 7. From a velocity-time graph, explain how you get the
- displacement
- acceleration
Self-Check Answers
SC 7.
-
From a velocity-time graph, you get the displacement by taking the area under the graph line.
-
From a velocity-time graph, you get the acceleration by taking the slope of the graph line.
Read
Read “Example 1.9” on page 40 and “Example 1.10” on pages 41 to 42 of the textbook to see how the acceleration and displacement are numerically calculated from a velocity-time graph.
Self-Check
SC 8. The areas of sections A and C of “Figure 1.46” on page 38 of your textbook were determined using a rectangle and a triangle in “Example 1.9.” For each section, draw the rectangle and triangle and give the dimensions.
Self-Check Answer
SC 8. 
Read
Read “Example 1.11” on pages 43 and 44 of the textbook to see how a position-time graph is drawn from a velocity-time graph.
Self-Check
SC 9. Go to page 44 of your textbook and complete question 7 of “1.4 Check and Reflect.”
SC 10. Go to page 45 of your textbook and complete question 18 of “1.4 Check and Reflect.”
Self-Check Answers
SC 9.
Analysis and Solution
Choose east to be the positive direction. The displacement is equal to the area under the Velocity vs. Time-graph line. The area can be divided into a rectangle and a triangle.
A = lw + ½ ab
= (10.0 s)(5.0 m/s) + ½(10.0 m/s)(5.0 s)
= 50 m + 25 m
= 75 m The positive value indicates the direction is east.
Paraphrase
The displacement from the graph is 75 m [E].
SC 10.
Analysis and Solution
Choose the positive direction to be toward the right. The slope of the Velocity vs. Time-graph is equal to the acceleration.
The positive value indicates the acceleration is directed to the right.
Paraphrase
The acceleration from the graph is 0.333 m/s2 [right].
Module 1: Lesson 4 Assignment
Remember to submit the answers to TR 1 and TR 2 to your teacher as part of your Module 1: Lesson 4 Assignment.
 Try This
In some complex motion situations, an object undergoes several different accelerations. Graphical analysis can be used to solve complex problems quickly and easily. Using the graphing capabilities of the 1D Non-Uniform Motion Builder Graphing (pos, vel, acc) simulation, collect graphical data and verify your answers for the following questions.
TR 1. You are riding in an elevator. Starting from rest, the elevator undergoes the following motions:
-
It accelerates from rest (v = 0.0 m/s) upwards for 5.0 s at +2.0 m/s2.
-
It then coasts for 20.0 s at 10.0 m/s (a = 0.0 m/s2).
-
Finally, starting at 10.0 m/s, it accelerates downward for 2.5 s at –4.00 m/s2.
- Complete a position-time graph.

- Complete a velocity-time graph.
-
Complete an acceleration-time graph.
-
Using the slope of the position-time graph, determine the maximum speed reached by the elevator.
-
Using area, determine how far the elevator travelled while coasting.
-
Using area, determine how far the elevator travelled while accelerating downward.
TR 2. Basam is standing on the edge of a cliff and tosses her physics book upward with a speed of 22.0 m/s. It hits the ground at the base of the cliff 6.0 s later. Use the 1D Non-Uniform Motion Builder Graphing (pos, vel, acc) simulation to determine how high the cliff is and how fast the book was moving when it landed.
TR 3. Fill in the blanks using the terms position, velocity, or acceleration.
-
A change in position in an interval of time is called ______________.
-
Velocity acting for an interval of time produces a change in ______________.
-
A change in velocity in an interval of time is called ______________.
-
Acceleration acting for an interval of time produces a change in _____________.