Module 1—Motion
 Explore
 Watch and Listen
Watch the Accelerated Motion animation showing graphs of a space launch. Look for the similarities and differences in the three graphs describing the same motion in different terms.
 Self-Check
SC 1. Describe the graph lines depicting uniform acceleration shown in the Accelerated Motion animation.
-
position-time graph
-
velocity-time graph
-
acceleration-time graph
 Self-Check Answers
SC 1.
- The position-time graph line was a curved diagonal line with a gradually increasing slope.
- The velocity-time graph was a straight diagonal line going from lower left to upper right.
- The acceleration-time graph was a horizontal line
 Lesson 4 Lab: Slope and Position-Time, Velocity-Time, and Acceleration-Time Graphs

© Mike Brown/Dreamstime
The launch of a space shuttle is an example of non-uniform (accelerated) motion. Graphical analysis of the shuttle’s position with respect to time will reveal the relationships between position, velocity, and acceleration.
The simulation used for this lab lets you specify motions and construct position-time, velocity-time, and acceleration-time graphs. You can learn more about the simulation by reading the Show Me found at the top of the simulation screen.
Problem
How are position-time, velocity-time, and acceleration-time graphs related by slope?
Open the 1D Non-Uniform Motion Builder Graphing (pos, vel, acc) simulation. If you cannot see the Play and Pause buttons on the bottom of the page, you may need to adjust the window. Click on the coloured title bar at the top, and drag the window to the upper right-hand corner of your screen. Then expand the window down by holding your cursor on the bottom border, clicking on the double-headed arrow that appears and dragging it down till you clearly see the bottom buttons. You can adjust the side margins in a similar way to remove the unused black areas. It will be convenient to have this window tight to the right side of your screen. After these adjustments, continue with the procedure.
Procedure
Use the simulation to generate a position-time graph for the shuttle launch, which is initially at rest (v = 0.0 m/s) and accelerates at 5.0 m/s2 for 10.0 s.
Step 1: Click “Reset” (![]() ), and then “Add” (
), and then “Add” (![]() ) to add an object.
) to add an object.

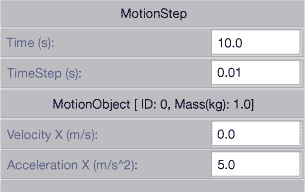
Step 2: In the “MotionStep EditorDialog” window, enter a time of 10.0 s, an initial velocity of 0.0 m/s, and an acceleration of 5.0 m/s2. Then click OK.
Step 3: Click “Play” (![]() ), and watch the moving object (
), and watch the moving object (![]() ) accelerate.
) accelerate.
Step 4: To view the position-time graph, do the following:
- Click “Graph.”

- Set “Horizontal Axis” to “Time” by clicking on the down arrow on the right of the horizontal axis box. Then move the slider on the right up to see “Time” and click on it.
![]()
- Set “Vert. Axis” to position by choosing “x0”.

- Click “Fit Graph to the Screen.”

Step 5: To view the slope, expand the graph window by dragging the margin to the right with the double-headed arrow as described earlier till you see the “Slope Mode” button, ![]() .
.
Click this “Slope Mode” button. Click and hold the mouse cursor over the graph line, and the slope value (m/s) will be indicated under Output. You can expand the graph down by dragging the bottom border of the window down and then dragging down the line under the “Zoom Out” button. You can also use the arrows under the “Zoom In” button, but the size adjustment is not as flexible.
instantaneous velocity: the velocity of an object at an instant of time; the slope of the tangent line to the position-time graph for the selected time
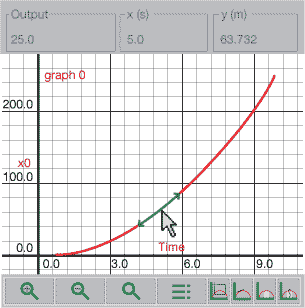
Verify that your graph is similar to Figure 1. The slope value is displayed under Output and represents the shuttle’s instantaneous velocity at the selected time. For example, Figure 1 shows an instantaneous velocity of +25.0 m/s at 5.0 s.

Figure 1
Observation and Analysis
 Module 1: Lesson 4 Assignment
Remember to submit the answers to LAB 1, LAB 2, LAB 3, LAB 4, LAB 5, and LAB 6 to your teacher as part of your Module 1: Lesson 4 Assignment.
LAB 1. Explain how you can tell that the motion of the shuttle is speeding up. In your explanation, refer to the term slope.

LAB 2. Use the position-time graph to complete the following tasks.
- Complete the following table. (Click the “Slope Mode” button,
 , and put your cursor on the exact time value on the graph line for the point you wish to examine. The time value is displayed at the top under the x (s). The velocity will be displayed under Output.)
Time (s)
Velocity (slope) m/s
0
2
4
6
8
- Using the velocity data collect in LAB 2.a., complete a velocity-time graph for the space shuttle launch.

LAB 3. Which of the following best describes the shuttle launch velocity-time graph?
-
The graph is constant and of the mathematical form y = b, where b is a constant.
-
The graph is linear and of the mathematical form y = mx + b, where b is a constant and m is the slope.
-
The graph is a quadratic curve and of the form y = ax2 + bx + c, where a, b, and c are coefficients.
LAB 4. Write an equation expressing the relation between velocity and time.
It is clear from the previous exercises that the velocity of the shuttle discussed above is not constant. The velocity is continuously changing from a value of 0.0 m/s to a value of 40.0 m/s after 8.0 s. There is clear evidence that the shuttle is accelerating.
LAB 5. Use the simulation to create a velocity-time graph based on the same time, velocity, and acceleration values that were entered in the procedure.
- Change the vertical axis (“Vert Axis”) to show velocity (“vx0”).
![]()
- Click “Fit Graph to the Screen.”
![]()
- Verify that this graph is identical to the velocity-time graph you created in LAB 2.
-
Calculate the slope mathematically, and verify your answer using the slope tool on the simulation.
-
What are the units that correctly describe the slope of a velocity-time graph? (Hint: Make sure you put the units into your calculation in LAB 5.a. and that you computed them.)
-
What does the slope on a velocity-time graph mean? That is, what quantity of motion does the slope measure?

LAB 6. Use the simulation to create an acceleration-time graph based on the same time, velocity, and acceleration values that were entered in the procedure.
- Change the vertical axis (“Vert. Axis”) to show acceleration (“ax0”).
- Click “Fit Graph to the Screen.”

-
Complete an acceleration-time graph.
-
In LAB 5 you determined the slope of the velocity-time graph for the shuttle launch. Where or how does that “appear” on the acceleration-time graph?
-
Is the slope of graph 2 equal to zero? What does this mean?
Lab Summary
How are position-time, velocity-time, and acceleration-time graphs related by slope?
The slope of a position-time graph describes velocity.
The slope of a velocity-time graph describes acceleration.

 Read
Read
Read “Velocity-time Graphs: Uniform and Non-uniform Motion” on pages 21 to 24 of the textbook. Look for how directions are handled and the formulas and symbols used to solve the problems.
 Self-Check
non-uniform motion: motion that is not at a constant speed in a straight line
SC 2. How is the slope of a velocity-time graph of uniform motion different than the slope of a velocity-time graph of non-uniform motion?
SC 3. Go to page 30 of your textbook and complete question 2 of “1.3 Check and Reflect.”
 Self-Check Answers
SC 2. The slope of a velocity-time graph of uniform motion is zero (flat). The slope of a velocity-time graph of non-uniform motion has a non-zero value (diagonal line).
SC 3. The object is moving to the left with ever increasing speed.
 Read
Read
Read “Instantaneous Velocity” on pages 24 and 25 of the textbook.
 Self-Check
SC 4. What does the slope of the tangent to a curved position-time graph give you?
 Self-Check Answers
instantaneous velocity: the velocity of an object at an instant of time; the slope of the tangent line to the position-time graph for the selected time
SC 4. The slope of the tangent to a curved position-time graph gives the velocity at that exact time, called the instantaneous velocity.
 Read
Read
Read “Using Slopes of Position-time Graphs to draw Velocity-time Graphs” on pages 25 to 28 of the textbook. Look for how directions are indicated by positive and negative signs. Note the formulas and symbols used to solve the problems.
 Self-Check
SC 5. Go to page 30 of your textbook and complete question 3 of “1.3 Check and Reflect.” Note that these are velocity-time graphs.
 Self-Check Answers
SC 5. (i) A (ii) B (iii) C (iv) D
 Read
Read
Read “Negative Acceleration Does Not Necessarily Mean Slowing Down” on pages 28 and 29 of the textbook. Look for the answer to the following Self-Check question.
 Self-Check
SC 6. Under what circumstances could an object have a negative acceleration and not be slowing down?
 Self-Check Answer
SC 6. An object could have a negative acceleration and not be slowing down if the direction of the velocity was also negative.