Module 1—Motion
Lesson 4—Graphical Analysis of Accelerated Motion
 Get Focused
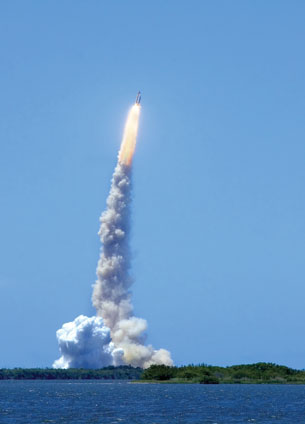
© Dennis Sabo/shutterstock
“T-minus 5, 4, 3, 2, 1. We have a ‘go’ for main engine ignition.” This is the familiar conversation you hear from mission control when you watch a shuttle launch on television. What you don’t hear is exactly how the shuttle—with a mass of more than 70 000 kg, depending on the payload—will achieve a speed of roughly 7600 m/s in less than 9 minutes after main engine ignition. Here is the sequence of events that occurs during the launch.
- Shuttle engines start at 100% of their maximum power, creating a combined maximum thrust of more than 4 million N.
- The shuttle engines are throttled back to around 64% of maximum power shortly after liftoff in order to keep the atmospheric pressure on the shuttle low as it climbs through the dense lower atmosphere.
- After climbing 10 668 m at a speed of 3413 m/s, the engines’ power is increased to near 100% again.
-
In the last minute of the launch, the engine power is reduced to keep the acceleration of the shuttle at a rate no more than three times that of gravity (29.43 m/s2) as it leaves Earth’s upper atmosphere.
It’s an incredible ride, for sure, and one that needs to be accurately understood so that it can be accomplished safely. From basic data about position, how can you illustrate and determine the velocity and acceleration of a vehicle, such as the shuttle during launch?
accelerated motion: motion of an object that is either increasing or decreasing in speed or changing direction
acceleration-time graph: a graph showing the acceleration of an object at varying times, where time is the independent variable and acceleration is the dependent variable
slope: a measure of the steepness of a curve
area: a quantity specifying the size of a region
In this lesson and the accompanying lab activities you will describe and compare one-dimensional, accelerated motion using position-time, velocity-time, and acceleration-time graphs. Using slope and area calculations, you will be able to generate data and solve problems related to accelerated motion.
There are two general problems to solve in the lab activities:
-
How are position-time, velocity-time, and acceleration-time graphs related by slope?
-
How are position-time, velocity-time, and acceleration-time graphs related by area?
 Module 1: Lesson 4 Assignments
Your teacher-marked Module 1: Lesson 4 Assignment requires you to submit a response to the following:
-
Lab—LAB 1, LAB 2, LAB 3, LAB 4, LAB 5, LAB 6, LAB 8, LAB 11, and LAB 12
-
Try This—TR 1and TR 2
You must decide what to do with the questions that are not marked by your teacher.
Remember that these other questions provide you with the practice and feedback that you need to successfully complete this course. You should respond to all the questions and place those answers in your course folder.