Module 1—Motion
Part 5: Determining Displacement Using a Velocity-Time Graph
Velocity-time graphs reveal more than just the velocity of a moving object. They can also be used to determine the object’s displacement during a specific time period.

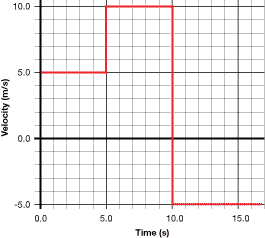
For example, the velocity-time graph on the right illustrates three phases of motion for an object travelling along a straight path over a given time interval. There are three different velocities.
-
5.0 s at +5.0 m/s
-
5.0 s at +10.0 m/s
-
7.0 s at –5.0 m/s
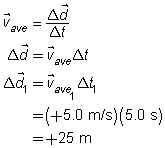
The displacement in each phase can be calculated using ![]() for each phase of the motion as follows:
for each phase of the motion as follows:


The total displacement is the sum of all three phases of motion.


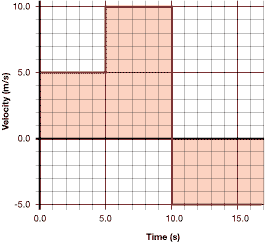
There is another method of determining the total displacement using the velocity-time graph. On the graph to the right, the area between the line and the time axis is also equal to the product of the velocity and time. The shaded area represents the total displacement, where the area above the time axis is positive and the area below is negative.

The area between a velocity-time graph and the time axis for a given interval of time is equal to the displacement of the object in that interval of time.