Module 1—Motion
Part 4: Interpreting Velocity-Time Graphs for Motion in One Dimension
Velocity-time graphs also tell a story about motion. These graphs contain more information than you may expect. They can be used to visualize the velocity of an object moving along a straight path during a given time interval. The following Try This activity involves reading and interpreting velocity-time graphs to determine specific information.
 Module 1: Lesson 3 Assignment
Remember to submit the answer to TR 8 to your teacher as part of your Module 1: Lesson 3 Assignment.
 Try This

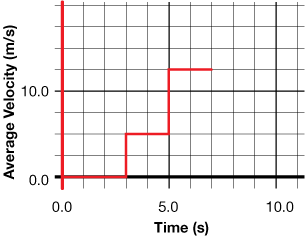
TR 8. A car travels along a straight road. The following simplified graph shows the car’s average velocity over several selected time periods during a 7.0-s time interval.
-
What was the average speed of the car during the 0.0–3.0-s time interval? ________m/s
-
What was the average speed of the car during the 3.0–5.0-s time interval? ______m/s
-
What was the average speed of the car during the 5.0–7.0-s time interval? ______m/s
-
Using
 , calculate how far the car travels during the 0.0–3.0-s time interval.
-
How could you determine the distance that the car would travel for the entire 7-s interval?

© Mikolaj Tomczak/shutterstock
TR 9. A car travels along a straight path with three different velocities, as shown in the following table.
Time Interval (s) |
Velocity (m/s) |
0.0–3.0 |
2.0 |
3.0–6.0 |
10.0 |
6.0–8.0 |
6.0 |
- On the simulation, click “Reset” (
 ). Clear all motion steps from the simulation. Enter each time interval and velocity in the simulation, and play the motion. Complete the graph by generating a velocity-time graph on the simulation.
- Click “Graph.”
![]()
- Set the “Horiz. Axis” to “Time.”
- Set the “Vert. Axis” to velocity (“x0”).

- Click “Fit Graph to the Screen.” (
 ).
).
 Module 1: Lesson 3 Assignment
Remember to submit the answer to TR 10 to your teacher as part of your Module 1: Lesson 3 Assignment.
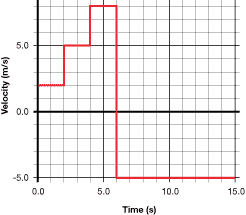
TR 10. An elevator moves up and down between floors in a building. The following graph shows the velocity of an elevator that was moving over a 15.0-s time interval.


© Yanik Chauvin/shutterstock
- What is the fastest velocity? During what time interval does this occur?
- What is the lowest velocity? During which time interval does this occur?
- Does the elevator move in two different directions? How can this be determined using the graph, and how is this illustrated using the x-axis?
- The graph illustrates four distinct “phases” for the motion. Complete the following table, and then enter these values into the simulation to reproduce the horizontal equivalent of the elevator’s motion.
Time Interval (s)
Velocity (m/s)
_________
_________
_________
_________
_________
_________
_________
_________