Module 1—Motion
 Explore
 Watch and Listen
Watch the Position-Time animation. Look for the answer to the following Self-Check question.
 Self-Check
SC 1. How does the graph line differ from the path that Taylor took during that time?
 Self-Check Answer
SC 1. The graph line is a two-dimensional diagram, moving up and down as well as to the right. Taylor moved back and forth on the same street, which is a one-dimensional path.
Part 1: Interpreting Position-Time Graphs for Motion in One Dimension
The fundamental graph used to visualize motion is the position-time graph. This type of graph is used to visualize the change in position for an object or person moving along a straight path during a given time interval. There is a large amount of information about the position of the moving object or person on this kind of graph. The following Try This activity involves reading and interpreting position-time graphs to determine specific information.
 Module 1: Lesson 3 Assignment
Remember to submit the answers to TR 1, TR 2, and TR 3 to your teacher as part of your Module 1: Lesson 3 Assignment.
 Try This
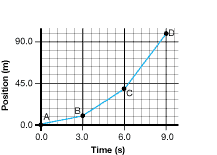
TR 1. Jordan is motorcycling along a straight path. The position-time graph illustrates his position (measured from the starting position) plotted against time. What can this graph tell you about Jordan’s movement and location?
-
Describe Jordan’s position at the following points:
A: ______ m, B: ______ m, C: ______ m, D: ______ m
-
What is his displacement in the first 3.0 s?
-
What is his displacement in the first 9.0 s?
-
What is his displacement when motorcycling from point B to point D?
-
Is all of the motion in the same direction? How do you determine this by using the graph?
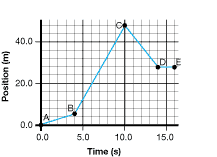
TR 2. A basketball rolls across the gym floor, is hit by another ball, bounces off the far wall, and gets trapped under a chair on the gym floor.

© zimmytws/shutterstock
-
What was the ball’s displacement when it hit the far wall of the gym, and how long did it take to get there? ___________ m, ____________ s
-
What is different about the ball’s motion from 4 s to 10 s (from point B to point C) compared to the motion from 10 s to 14 s (from point C to point D)?
-
Use the terms forward, backward, and stopped to describe the motion of the ball between the following points:
A–B __________ B–C ____________
C–D __________ D–E_____________
-
How far away is the chair from the far wall of the gym?
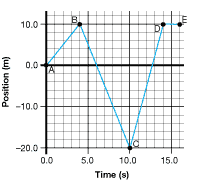
TR 3. A lawn mower is pushed along a straight path. The graph shows the position of the mower over a 16.0-s time interval.

© Stephane Tougard/shutterstock
-
How many times was the mower at the starting position?
-
Where is position C relative to the starting position—in front or behind? Is this a positive (+) or negative (–) position?
-
Which two motions are in the same direction?
A. A–B and B–C
B. A–B and C–D
C. B–C and D–E
D. B–C and C–D
-
The motion switched direction two times. At which two points did the direction of the motion reverse? Explain how this is indicated on the graph.
-
Explain how the position-time graph for the lawn mower could be used to develop an automated program to control the motion of a self-propelled mower.
Part 2: Determining Velocity Using a Position-Time Graph
 Read
Read
In order to know how to get even more information from a graph, read “Position-time Graphs and Uniform Motion” on pages 11 and 12 of your textbook. You will see that the concepts learned in Lessons 1 and 2 are being used here very effectively. Look for ways that graphs can help find answers to problems.
 Self-Check
SC 2. What information does the slope of the graph line in a position-time graph tell you?
 Self-Check Answer
SC 2. The slope of the graph line in a position-time graph gives the average velocity during that time period.
 Read
Read
Look for the answers to the following Self-Check questions as you read “Speed and Velocity” and “Frame of Reference” on pages 12 to 14 of your textbook.
 Self-Check
SC 3. How can two objects have the same speed but have different velocities?
SC 4. If you change the frame of reference, how could that affect the velocity?
 Self-Check Answers
SC 3.Two objects can have the same speed but have different velocities if they are travelling in different directions.
SC 4. The sign of the velocity during that time period could change from positive to negative, or vice-versa.
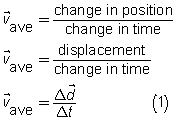
Here is a different way of looking at the situation. Recall from Lesson 1 that velocity is defined as the rate of change of position of an object. Mathematically, it is defined as
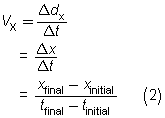
When applied to one-dimensional motion on the x-axis and using x components, the definition becomes
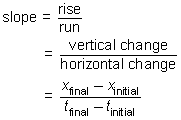
How does the definition of velocity, as given by equation (2), relate to a position-time graph? Look at segment CD in the position-time graph in Figure 1. The slope of that segment can be found using the formula
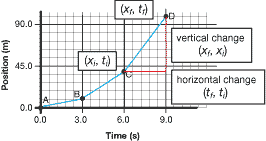
Figure 1
This is the right side of equation 2, so the velocity and the slope are the same.
This shows that the slope of the line on a position-time graph is equal to the velocity of the object.
The slope of a position-time graph for a given time interval in which the graph is a straight line is equal to the velocity in that time interval.
 Self-Check
SC 5. Complete question 10 of “1.2 Check and Reflect” on page 20 of your textbook, using slope to determine velocity for each lettered stage of the motion.
 Self-Check Answer
SC 5.
Part A

The motion in part A is uniform motion at 4.0 m/s [W].
Part B
The slope of part B is zero, so during part B the motion is stopped.
Part C

The motion in part C is uniform motion at –2.0 m/s [W] or 2.0 m/s [E].
 Module 1: Lesson 3 Assignment
Remember to submit the answer to TR 4 to your teacher as part of your Module 1: Lesson 3 Assignment.
 Try This

TR 4. Calculate the velocity (slope) for each time interval in the following position-time graph. Show all of your work, including correct units and directions using a positive/negative x-axis.
-
velocity from point A to point B
-
velocity from point B to point C
-
velocity from point C to point D