
Goodshoot/Thinkstock
In Try This 3 you may have noticed that it is possible to use the graphs of functions to interpret a composition of those functions. One method of using graphs of functions to interpret the composite function is to work through each function separately.
For example, to find the driving time d, first determine the congestion C (which is number of cars on the road) at a specific time t (which is the number of hours after midnight). Then use the value of congestion to determine the driving time. Using function notation, the function d = D(C(t)) can be found by starting at a t-value and using c = C(t) to determine a c-value. The c-value is then used to determine the d-value using d = D(c).
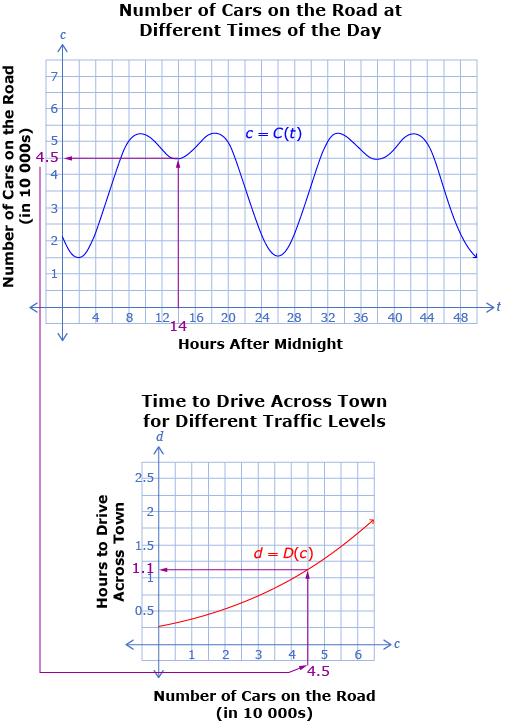
Here, a t-value of 14 h after midnight is used to determine a c-value of 4.5 number of cars.
This c-value is then used to determine a d-value of 1.1 h to drive across town.
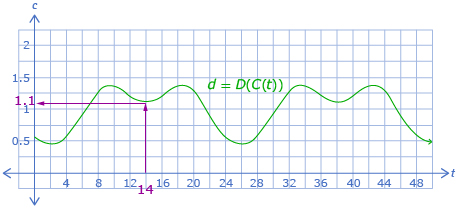
If a graph of the composite function is available, it is possible to determine the information from the previous graph in one step.
This relationship can be used to determine the graph of f(g(x)) using the graphs of f(x) and g(x) by determining the points one at a time. However, an easier way to determine a graph is to use equations if they are available. The equations of f(x) and g(x) can then be used to determine an equation for f(g(x)), which can then be plotted, as you did earlier in the lesson.