Interpreting graphs when multiplying or dividing functions is similar to interpreting graphs when adding or subtracting functions. Try This 2 explores this idea further.
Try This 2
Open Lesson 5 Printable Template. Either make a sketch of the graph or print the graph to complete the following activity.
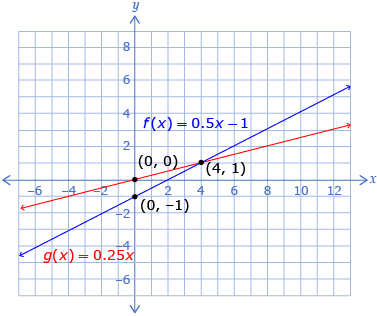
- Use the graph to sketch h(x) = (fg)(x). Explain the procedure you used.
- Predict where any vertical asymptotes for
 and
and  will occur. How are these asymptotes related to the non-permissible values of p(x) and q(x)?
- Sketch p(x) and q(x).
- What type of functions are h(x), p(x), and q(x)? Explain.
- State the domain for h(x), p(x), and q(x).
![]() Save your responses in your course folder.
Save your responses in your course folder.
Asymptotes occur at non-permissible values where the denominator is equal to zero. For what x-values will the denominators be zero?