It is possible to predict what the graph of a function that was produced by adding or subtracting two other functions will look like. Try This 3 explores this idea.
Try This 3
Consider the following two functions:
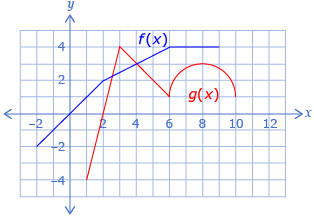
- Predict what graphs of the functions h(x) = (f + g)(x) and p(x) = (f − g)(x) will look like.
- Use the graphs of f(x) and g(x) to complete a table like the following.

x f(x) g(x) h(x) = (f + g)(x) p(x) = (f − g)(x) q(x) = (g − f)(x) −2 −2 undefined −1 −1 undefined 0 0 undefined 1 1 −4 2 2 0 3 2.5 4 4 3 3 5 3.5 2 6 4 1 7 4 2.7 8 4 3 9 4 2.7 10 undefined 1 - Either print the Printable Template or make a sketch of the information. Then use this data to sketch h(x), p(x), and g(x).
-
- Describe a strategy you could use to graph h(x) given the graphs of f(x) and g(x).
- Describe a strategy you could use to graph p(x) given the graphs of f(x) and g(x).
-
- Describe how the domain and range of f(x) and g(x) are related to the domain and range of h(x), p(x), and q(x).
- Describe the relationship between the graph of p(x) and the graph of q(x).
![]() Save your responses in your course folder.
Save your responses in your course folder.
Share 3
With a partner or group, discuss the following question based on your graphs created in Try This 3:
Describe a rule to determine the domain of r(x) using s(x) and t(x) if r(x) = s(x) + t(x).
![]() If required, save a record of your discussion in your course folder.
If required, save a record of your discussion in your course folder.
Do you expect (f + g)(x) to be defined when either f(x) or g(x) is undefined?