Explore
The graphs of rational functions can be used to estimate the solutions to rational equations using methods you have seen in previous lessons. In Try This 1 you may have noticed that if you graph each side of the equation as a separate function, the x-values of the intersections (the r-values in Try This 1) will give you the solutions to the equation.
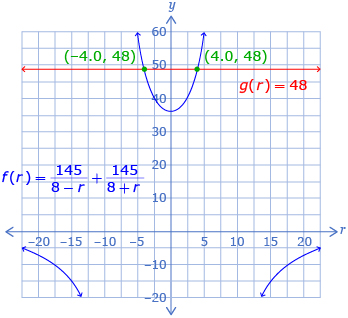
From this graph, the solutions to ![]() can be estimated as —4.0 and 4.0.
can be estimated as —4.0 and 4.0.
In previous sections you saw that there were multiple ways to estimate a solution from graphing. Try This 2 further explores another method.
Try This 2
Consider the equation ![]()
-
- Plot
 and
and  on the same graph.
 - Determine the intersections of f(x) and g(x).
- Plot
-
- How is
 related to
  ?
? - Plot h(x).
- Determine the x-intercepts of h(x). How are these values related to the ones you found in question 1.b?
- How is
-
- Explain a strategy that can be used to show that the x-values you found in questions 1.b. and 2.c. are solutions to
 .
. - Use your strategy to show that the x-values you found in questions 1.b. and 2.c. are solutions to
 .
.
- Explain a strategy that can be used to show that the x-values you found in questions 1.b. and 2.c. are solutions to
![]() Save your responses in your course folder.
Save your responses in your course folder.
Share 2
With a partner or group, discuss the similarities and differences between the two different graphing techniques used to solve rational equations in Try This 2. What benefits and/or drawbacks do you see to each method? Which method do you prefer?
![]() If required, save a record of your discussion in your course folder.
If required, save a record of your discussion in your course folder.