Explore
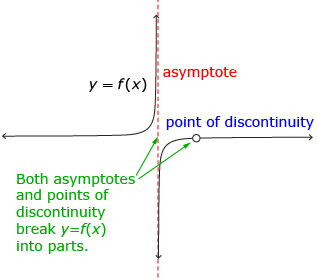
In Try This 1 you saw that the rational function ![]() contained two non-permissible values at r = 0 and r = −11.5. Both of these values created a discontinuity in the graph of the function; that is, you couldn’t draw the graph without lifting your pencil. One of these discontinuities showed up as an asymptote. You have seen these many times before. The other discontinuity showed up as a “missing” point on the function. This missing point is called a point of discontinuity or a hole and is usually represented with an open circle on the graph.
contained two non-permissible values at r = 0 and r = −11.5. Both of these values created a discontinuity in the graph of the function; that is, you couldn’t draw the graph without lifting your pencil. One of these discontinuities showed up as an asymptote. You have seen these many times before. The other discontinuity showed up as a “missing” point on the function. This missing point is called a point of discontinuity or a hole and is usually represented with an open circle on the graph.
If the function ![]() is simplified to
is simplified to ![]() , the restriction r ≠ 0 needs to be placed on the function to maintain the original restrictions.
, the restriction r ≠ 0 needs to be placed on the function to maintain the original restrictions.
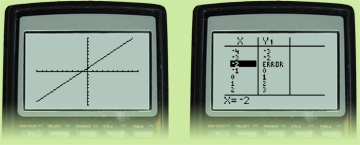
The graph of this rational function does not appear to have any
points of discontinuity; however, by checking the table of values,
you can see that −2 is a point of discontinuity.
Although some graphing software will show where points of discontinuity occur when a rational function is graphed, many graphing calculators do not. It is up to the user to determine where these points occur and to interpret the graph correctly.
If a graphing calculator shows a table of values for a function, this can sometimes be used to determine where a point of discontinuity is. Typically the y-value corresponding to the non-permissible x-value will show some type of error message.