So far, you have experimented with rational functions of the forms ![]() and
and ![]() In Try This 3 you will investigate graphing slightly more complex rational functions using transformations.
In Try This 3 you will investigate graphing slightly more complex rational functions using transformations.
Try This 3
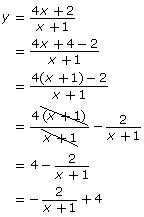
- Carolina is planning on graphing the function
 by hand using transformations. She completes the following steps:

Explain why Carolina changed the format. - Although Carolina’s method is correct, the method will typically only work with rational functions that include a linear polynomial in the numerator and denominator. Describe two other methods you could use to graph the function

- Explain whether the methods you described in question 2 will allow you to graph the following rational functions:
-
- Graph the functions from question 3 using technology; then use your graphs to complete a table like the following.
Function


Non-permissible Value(s) Vertical Asymptote(s) Horizontal Asymptote(s) x-intercept(s) y-intercept(s) Domain Range End Behaviour
- Describe any similarities and/or patterns you notice between the graphs of the three functions.
- Graph the functions from question 3 using technology; then use your graphs to complete a table like the following.
Share 2
With a partner or group, discuss the following questions based on your graphs created in Try This 3.
- Describe why a graphing strategy that uses transformations may be more difficult to use for rational functions than some of the other functions used in this course.
- Compare the patterns you saw in question 4. Do you expect these patterns will hold for all rational functions? Explain.
![]() If required, save a record of your discussion in your course folder.
If required, save a record of your discussion in your course folder.