Discover
iStockphoto/Thinkstock
Try This 1
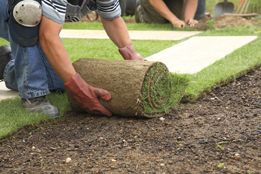
You are planning to install sod in your yard. You calculated that the installation will require 240 rolls and you have placed an order. Unfortunately, the delivery person read the address incorrectly and dropped off the sod at a house a block away. The delivery truck came from out of town and will not be able to return to help you move the sod. You begin to contemplate the effort it would take to move the sod, and you consider various means of transportation. Each piece weighs about 12 kg, so you make the following estimates.
Transportation Method |
Number of Rolls Moved at a Time |
| Neighbour’s Cat | 0.2 |
| 7-year-old Next Door | 0.5 |
| 12-year-old Next Door | 1 |
| Yourself | 2 |
| You and a Friend | 4 |
| Wheelbarrow | 5 |
| Wagon | 8 |
| Car Trunk (This will be messy.) | 15 |
| Pick-up Truck | 40 |
- Copy and complete the following table of values:
Transportation Method
Number of Rolls Moved at a Time (r)
Number of Trips Required (T) Neighbour’s Cat 0.2
7-year-old Next Door 0.5
12-year-old Next Door 1
Yourself 2
You and a Friend 4
Wheelbarrow 5
Wagon 8
Car Trunk (This will be messy.) 15
Pick-up Truck 40
-
- Based on the data in the table, determine an equation that relates T to r.
- Plot T as a function of r.

-
- Plot the data from the table on the same coordinate plane as question 2.b.
- How are the graphs for questions 2.b. and 3.a. related?
-
- What happens to your graph of T as a function of r as r gets larger?
- What happens to T as r decreases to 0?
- Can r be 0? Can T be 0?
- Determine a domain and range for this scenario.
![]() Save your responses in your course folder.
Save your responses in your course folder.
Share 1
With a partner or group, discuss the following questions based on your graph created in Try This 1.
- Explain how your graph would look different if
- you needed to haul 480 rolls
- you needed to haul 240 rolls but had to add 4 extra trips to carry the wooden pallets the sod arrived on
- What would the graph of the equation you wrote look like if you included negative r-values? (This situation would not make sense in terms of rolls of sod.)
![]() If required, save a record of your discussion in your course folder.
If required, save a record of your discussion in your course folder.