Module 6: Exponents and Logarithms


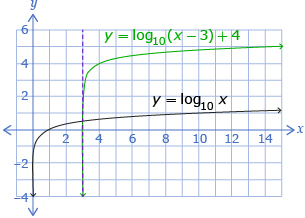
In Try This 3 you graphed a logarithmic function using transformations. You may have noticed that the function y = log10(x − 3) + 4 is the transformed graph of y = log10 x by a horizontal translation of right 3 units and a vertical translation of 4 units up.


Your graph may have looked like this one:


This is a graph of 2 logarithmic functions. The equations of the functions are y equals log base 10 of x minus 3 and then 4 is added to this function, and y equals log base 10 of x.


View Graphing Logarithmic Functions to see an example of how to graph a logarithmic function using transformations.


This is a play button that opens Graphing Logarithmic Functions.


Self-Check 2


textbook

  1. Complete question 1.c. on page 389 of the textbook. Answer
  2. Complete question 4.b. on page 390 of the textbook. Answer
  3. Complete question 5.b. on page 390 of the textbook. Answer
  4. Complete questions 1 to 5 in “Logarithmic Functions: Translating and Scaling.”

     
    This is a play button that opens “Logarithmic Functions: Translating and Scaling.”
    Screenshot reprinted with permission of ExploreLearning