Explore
In Try This 1 you graphed the exponential function f(x) = 5x and its inverse, f –1(x) = log5 x. The graph of f –1(x) = log5 x is the reflection of the graph of f(x) = 5x about the line y = x. The coordinates of the exponential function graph and its inverse are connected by the following map: (x, y)  (y, x).
Self-Check 1
- Use your knowledge of logarithmic functions to complete questions 1 to 5 in “Logarithmic Functions – Activity A.”
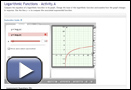
Screenshot reprinted with permission of ExploreLearning
- Complete questions 1.b. and 9 on page 380 of the textbook. Answers
Try This 2
Open Multiple Transformations. Deselect Quadratic by clicking on the box, and then select Logarithmic by clicking the box.
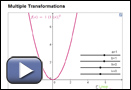
Screenshot reprinted with permission of ExploreLearning
- Use the sliders to increase and decrease the a-, b-, h-, and k-values. Describe how the parameters a, b, h, and k in the form
 transform the graph by completing a table like the one shown.
Parameter |
Effect on the Graph |
Do the domain, range, and/or vertical asymptote change? |
| a |
|
 |
| b |
|
|
| c |
|
|
| d |
|
|
- How do your responses compare to your knowledge of transformations from past lessons?
- Using Multiple Transformations, compare
 and y = logc x. Describe the effect of a, b, h, and k on the domain, range, and vertical asymptote.
 Save your responses in your course folder.
The domain can change.
There is no change.