Module 6: Lesson 1
Self-Check 4
-
Question 9 on page 356 of the textbook
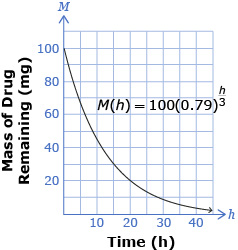
- The 0.79 represents the 79% of the drug that remains after every interval of time (in this case, that interval of time is every 3 h).
- A possible sketch of the graph follows.
Source: Pre-Calculus 12.
Whitby, ON: McGraw-Hill Ryerson, 2011.
Reproduced with permission.
- The M-intercept represents the amount of the drug that was initially taken (that is, the standard dose).
- The domain of the graph is {h|h ≥ 0, h ∈ R}. The range of the graph is {M|0 < M ≤ 100, M ∈ R}.
© 2012 Alberta Education