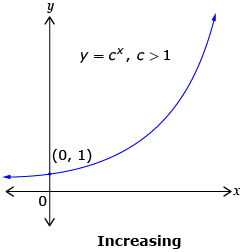
You may have noticed from Try This 2 that the graph increases when c > 1. This graph can be used to describe exponential growth.
Source: Pre-Calculus 12.
Whitby, ON: McGraw-Hill Ryerson, 2011.
Reproduced with permission.
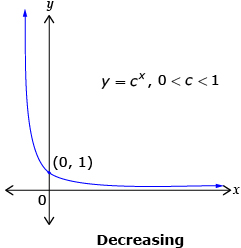
When 0 < c < 1, the graph decreases. This graph can be used to describe exponential decay.
Source: Pre-Calculus 12.
Whitby, ON: McGraw-Hill Ryerson, 2011.
Reproduced with permission.
The characteristics of all exponential functions of the form y = cx, c > 0, c ≠ 1 are as follows:
- The domain is {x|x ∈ R}.
- The range is {y|y > 0, y ∈ R}.
- There is no x-intercept.
- The y-intercept is 1.
- The horizontal asymptote is y = 0.