Pushing the Limits of Vehicle Performance
Project Overview
In this project you will be analyzing, modelling, and relating vehicles and racing to the concepts studied in Module 5.
Project Introduction
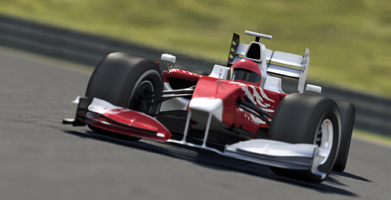
iStockphoto/Thinkstock
Ever since motor vehicles were invented, there has been a desire to test the limits of their performance. People’s interest in speed and action has led to a wide variety of different vehicle events ranging from simple races to monster truck rallies to various stunt shows. In this module you will focus on two high-speed events: a drag race and a motorcycle jump.
Towards the end of each lesson, under Project Connection, you may be prompted to complete a part of the Module 5 Project.
![]()
Make sure to save all your work from each Project Connection in your course folder. You will submit your Module 5 Project to your teacher at the end of Module 5. Make sure to show all your work.
You can choose any format you prefer for the project's final presentation. Some options include a written document, a virtual or a real poster, a website, a video, an oral report, and a PowerPoint. Visuals, calculations, and explanations must be provided as part of the presentation.
Activity 1
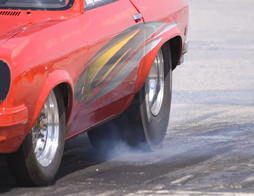
iStockphoto/Thinkstock
In this activity you will analyze some aspects of a drag race using the tangent function.
Part 1
In a drag race, two cars race side by side down a straight pair of 402-m tracks. You have bought a seat directly in front of the start line. While watching a particular race, you are frustrated to notice that your view of the car on the far track is blocked by the near car for the entire race. Although you cannot see the race properly, you realize you can determine how far apart the cars are when they finish the race if you know the distance to each track.
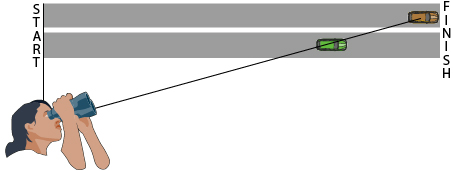
- Describe a strategy showing how you can use a tangent function to determine the distance one of the cars has travelled. Be specific.
- Graph the function from question 1 and explain what it means in this drag-racing scenario.
- Describe a strategy to show how you could use a single tangent function to determine the distance between the cars when this race finishes. Be specific.
- Explain any limitations to your strategy in question 3, and note any reasons why your strategy may be difficult to work with.
Part 2
You realize it is possible to determine the distance from you to one of the cars if you know the size of the angle, θ, between the start line and the car.
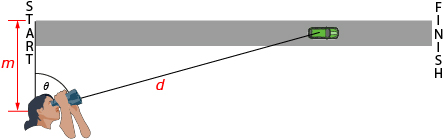
- Use the tangent function for the distance a car has travelled from Part 1 and the Pythagorean theorem to prove d = |m sec θ|, where d is the distance from you to the car and m is the distance from you to the track.

You may want to have your teacher confirm your tangent function found in Part 1 before you begin the proof. - For what angles is your proof valid? Explain.
- Calculate the value of d using cos θ. Use this value of d to verify d = |m sec θ|.
- Explain why the absolute value signs are not necessary in the expression d = |a sec θ| for this scenario.
- Explain whether or not this is a good strategy to determine the distance to the car.
Activity 2
Creatas/Jupiterimages/Thinkstock
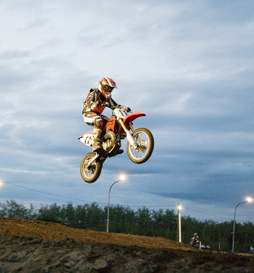
During the early 1970s, Evel Knievel was one of the world's best known daredevil motorcyclists. He defied gravity as he rode his bike in increasingly challenging, dangerous stunts. Though he had many great jumps in the mid-1970s, his attempt to jump a row of double-decker buses at Wembley Stadium in London was unsuccessful.
In this activity you are planning to jump a row of semitrailers with your motorcycle. You will need to determine the top speed of your motorcycle and a launch angle to safely set up the jump. This is a simplification of the calculations needed, and a real jump requires much more planning than the organizing for this activity. Don't try this at home!
Part 1
To determine the jumping distance, you will first need to determine the maximum speed of your motorcycle. Unfortunately, the speedometer only shows up to 140 km/h, and while this may be fast enough for Alberta highways, it won’t be fast enough for this performance. Fortunately, your tachometer, the gauge that shows engine speed, will allow you to determine higher vehicle speeds.
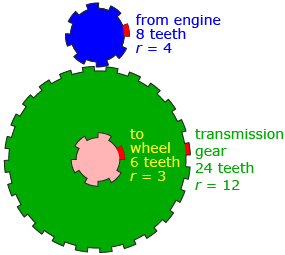
First, you will need to familiarize yourself with how the gears work for a motorcycle. Although vehicle gearing for most motorcycles is fairly complex, a simplified set of gears can explain why changing gears allows the vehicle to move faster (similar to changing gears on a bicycle). In this simplified example, the engine gear (blue) turns a transmission gear (green), which turns another gear that is connected to the motorcycle wheels (red).
Open Gears, which shows how the different motorcycle gears turn each other. Although the gears aren’t lined up like this in most vehicles, the effect is similar. Pay attention to how the red tooth moves on each gear.

- Draw a graph to model each of the three gears. The graphs should show the relationship of the height of a tooth to the angle of rotation of the engine gear. Be sure to explain any assumptions you make while drawing your graphs.
Some suggestions are as follows:- Decide on a reference point from which you will measure all heights.
- On your graph, use either the number of rotations or the angle of rotation of the engine gear for the units of the horizontal axis.
- Pick one gear to begin with. Determine the characteristics of that gear (such as minimum, maximum, and amplitude). Then move on to another gear.
- What characteristic of the graphs can you use to compare the speeds of the three gears? Explain.
- When changing gears, the green transmission gear is changed for a gear with a different number of teeth, while the rest of the system stays the same. How would your graphs change if the green transmission gear was changed for a gear with more teeth? Be specific.
- Suppose you know the following information about your motorcycle:
Number of teeth on available transmission (green) gears 24, 30, 36 Top engine rotation speed (blue gear) 5200 revolutions per minute (rpm) Tire diameter 70 cm
Assuming a gear setup like the gear diagram, determine the motorcycle’s maximum speed. Be sure to include any assumptions you make to answer this question.
Here are some things to consider:- Which transmission gear should you pick to give the maximum speed for the gear leading to the wheels?
- If the engine gear turns at 5200 rpm, at what speed does the wheel gear turn?
- The distance travelled by one revolution of the wheel can be calculated using C = πd OR the distance travelled if the wheel turns through θ radians can be calculated using a = rθ.
- The unit cm/min can be converted to m/s by multiplying by
 or to km/h by multiplying by
- Explain whether or not these five steps is a good strategy for determining a vehicle’s top speed.
Part 2
Now that you have a maximum speed, you will need to determine how to set up the big motorcycle jump. The plan is to travel at maximum speed over a ramp, jump semis lined end to end, and land on a second ramp. You will need to determine the ramp angle and how many semis to line up.
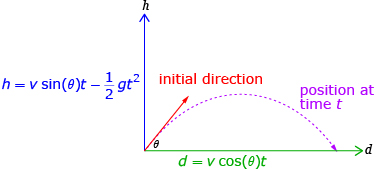
- First, determine how far you will jump. When an object is launched at an angle, θ, with a velocity, v, in m/s, you can imagine the object's motion is split into a horizontal component and a vertical component.
Horizontal component (the horizontal distance, d metres, travelled at time, t seconds) d = v cos (θ) t Vertical component (the height, h metres, at time, t seconds. g = 9.8 m/s2) 
-
Let the height at the beginning of your jump be 0 m. What will the height be when you land?
- Use the vertical component equation to determine an equation representing the times the height is 0 m. Which of these times represents the landing?
- Substitute the landing time expression from part b. into the horizontal component equation and prove that the new equation can be reduced to
 . Be sure to include any necessary restrictions for your proof.
-
- A number of 16-m semitrailers have been donated for the jump. Assuming you will be launching at top speed, determine a ramp angle and a number of trailers that will allow you to land safely on the second ramp. Your ramps and trailers will need to be set end to end so that if something goes wrong, you won’t land between trailers. Include a diagram of your setup and any assumptions you make to solve this problem.
- Explain whether or not this is a good method for predicting the jumping distance.
Conclusion
Write a brief conclusion to your Module 5 Project: Pushing the Limits of Vehicle Performance. Describe why you think you were asked to use roundabout, unrealistic methods to solve some of these problems. Include a personal reflection of how you felt about the project during and after completion. Be sure to explain why you felt the way you did.
Project Assessment
Your Module 5 Project will be evaluated by your teacher using the following evaluation guidelines. Read the rubric carefully. Make sure you have completed the requirements for each of the categories. You can print or save a digital copy of the Module 5 Project Rubric as a guide to help you complete your project.
Don’t forget to submit your completed Module 5 Project to your teacher at the end of Module 5.