Module 5: Lesson 2
Self-Check 2
- Questions 5, 16, and 18 on pages 275 to 279 of the textbook
-
- A graphical solution is shown.
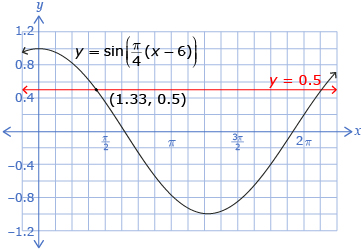
x ≈ 1.33 - An algebraic solution is shown.
363.590…° is not in the domain 0° < x ≤ 360°. However, the coterminal angle 363.590…° − 360° = 3.590…°.
So, x ≈ 3.59° and 86.41°. - An algebraic solution is shown.
On the domain 0 < 2x − 5 ≤ 2 π,
x ≈ 3.093 + nπ, n ∈ I, x ∈ R and x ≈ 5.048 + nπ, n ∈ I, x ∈ R. - A graphical solution is shown.
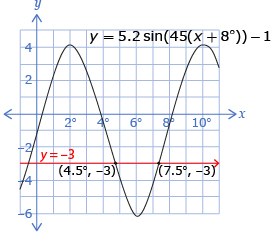
The first two solutions occur at x ≈ 4.5° and 7.5°. Because the period is 8°, the general equation is x ≈ 4.5°, 7.5° ± (8°) n, n ∈ I.
- A graphical solution is shown.
-
Adapted from: Pre-Calculus 12. Whitby, ON:
McGraw-Hill Ryerson, 2011. Reproduced with permission.
- The temperature that is halfway between the maximum average monthly temperature and the minimum average monthly temperature in Winnipeg can be found by performing the following operation:
- The a value can be determined by finding the amplitude:

This means that the amplitude is
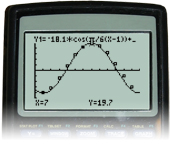
The graph appears to be a sinusoidal graph (of cosine) that has been reflected about the x-axis; this means that you can state that the a value is −18.1. If this is done, there will be a phase shift of 1 unit to the right (because the lowest temperature occurs in January, or the first month). The period is about 12 months. This means that the b value is The vertical displacement is
Therefore, an approximate equation for the sinusoidal function is In this formula, x represents the time, in months, and y represents the average monthly temperature, in degrees Celsius, for Winnipeg.
 -
Adapted from: Pre-Calculus 12. Whitby, ON:
McGraw-Hill Ryerson, 2011. Reproduced with permission.
-
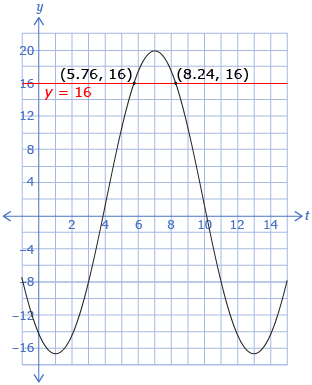
The two intersection points occur at (5.76, 16) and (8.24, 16). This means that the average temperature will be above 16°C for 8.24 − 5.76, or for approximately 2.5 months.
-
-
Adapted from Pre-Calculus 12. Whitby, ON: McGraw-Hill Ryerson, 2011.
Reproduced with permission.
- The a value can be determined by finding the amplitude:
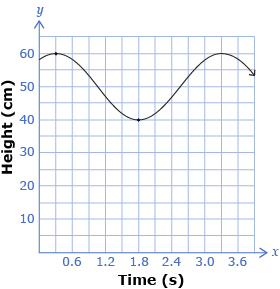
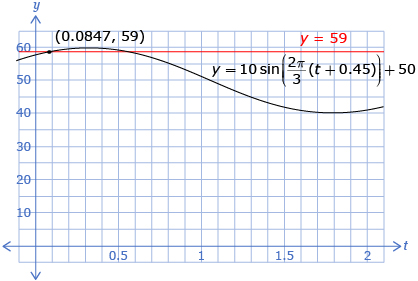
This means that the amplitude is you can state that the a value is 10. If this is done, there will be a phase shift of 0.45 units to the left. The period is 3.3 s − 0.3 s or 3 s. Thus, the b value is
  The vertical displacement is
Thus, an approximate equation for the sinusoidal function is In this formula, t represents the time, in seconds, and y represents the height of the mass, in centimetres, above the floor.
 - To do this, you can substitute 17.2 in place of t.
-
-
© 2012 Alberta Education