You have looked at how the parameters c and d can be used to sketch the graph of a sine or cosine function. In Try This 2 you will see how this process can also be done in reverse by determining c and d from a given graph.
Try This 2
- Determine the value of the midline for the graph shown. Use this value to determine d in the equation y = sin(x − c) + d.
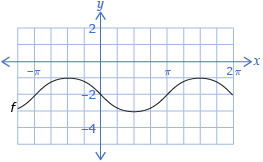
- Determine a value on the midline where the graph is increasing. Use this value to determine c in the equation y = sin(x − c) + d.
![]() Save a copy of your responses in your course folder.
Save a copy of your responses in your course folder.
Share 2
With a partner or in a group, discuss the following questions based on the graph from Try This 2.
- How many possible c-values are there for the graph? If there’s more than one value, give a second value and explain.
- How many possible d-values are there for the graph? If there’s more than one value, give a second value and explain.
- How would your method for determining c be different if this were a cosine graph?
![]() If required, save a record of your discussion in your course folder.
If required, save a record of your discussion in your course folder.