Explore
Functions in the form 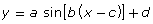 and
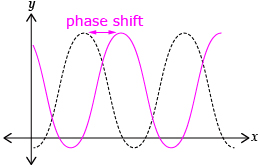
and  are said to be in standard form. In Try This 1 you explored the effects c and d had on functions in standard form. You may have noticed that increasing c caused a horizontal translation to the right c units. A horizontal translation is often called a phase shift for a periodic function.
Inserting a positive c-value into form  or
or 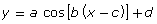 makes the c term appear negative. c = 5 gives
 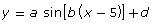 and can be thought of as
 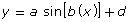 moved 5 units to the right.
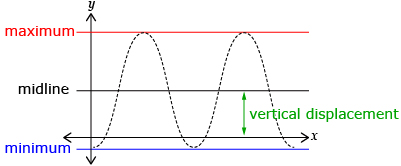
In Try This 1, increasing d caused a vertical translation up d units. A vertical translation is often called a vertical displacement for a periodic function.
Also, d gives the value of the midline, an imaginary line halfway between the maximum and minimum values. The midline can be determined using the formula 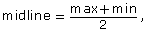 where max and min are the maximum and minimum values reached by the graph.

iStockphoto/Thinkstock
Read “Example 1” on page 240 of the textbook to see how a graph of the form y = sin(x − c) + d can be graphed and interpreted.
Self-Check 1
- Complete the “Your Turn” portion of “Example 1” on page 240 of the textbook. Answer
- Complete questions 1.a., 1.c., 2.a., 2.c., and 5 on page 250 of the textbook. Answer