Lesson 7: Graphing and Transforming Sine and Cosine Functions 2
Focus

rabbit: Photos.com/Thinkstock; lynx; iStockphoto/Thinkstock
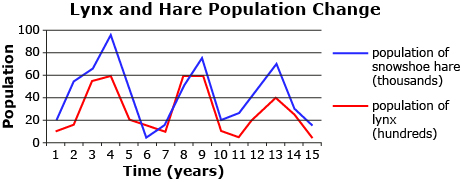
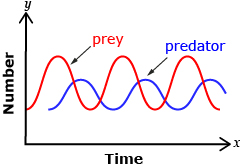
The Canadian lynx’s most important source of food is the snowshoe hare. When a predator has only one single significant source of food, the two populations follow a somewhat sinusoidal pattern as shown in the diagrams. Why does this cyclical pattern occur?
To model a relationship such as the one between the lynx and hare, you need to account for maximum and minimum populations and the length of a cycle. You learned how to work with these parameters in Lesson 6.
But there’s a problem. The graphs you used in Lesson 6 were centred about the x-axis and contained the point (0, 0) for a sine function or (0, amplitude) for a cosine function. Can you think of a strategy used earlier in the course to help you write a function that models these populations?
In this lesson you will discover how the equation of a sine or cosine function is related to phase shift and midline. You will then use this information, along with the period and amplitude, to graph and interpret the graphs of sine and cosine functions.
Lesson Outcomes
At the end of this lesson you will be able to
- sketch the graph of functions of the form
 and
and 
- relate the amplitude, period, phase shift, domain, and range to functions of the form
 and
and 
Lesson Questions
You will investigate the following questions:
- How can the functions and be represented graphically?
- How are the parameters a, b, c, and d of a sine or cosine function related to the transformations of the corresponding graph?
Assessment
Your assessment may be based on a combination of the following tasks:
- completion of the Lesson 7 Assignment (Download the Lesson 7 Assignment and save it in your course folder now.)
- course folder submissions from Try This and Share activities
- additions to Glossary Terms and Formula Sheet
- work under Project Connection