Lesson 6 Summary
There are many ways to visually represent trigonometric functions. One of the most useful representations is a graph on a Cartesian plane. The sine and cosine functions have the same shape, and both can be transformed in the same manner as other functions.
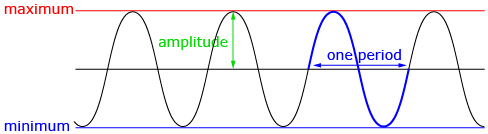
The amplitude of a sinusoidal function is half the distance between the minimum and maximum value of the graph. The value of the amplitude is equal to the parameter a and can be found using ![]()
The period of a periodic function is the horizontal distance taken to complete one graph cycle. The period is related to the parameter b by the equation ![]() where P is the period.
where P is the period.
In Lesson 7 you will explore two other characteristics of a sinusoidal graph in addition to amplitude and period. In Module 5 you will begin to explore modelling cyclic behavior, such as the height of a mark on a bicycle tire over time. Think of the shape this graph will take.