When sketching a graph, be sure to remember these steps:
- Label your axes.
- Show a scale on both the x- and y-axes.
- Plot some points, and then use those points to sketch a smooth curve.
- Try to fill up most of the space available.
- Show at least one full cycle.
Self-Check 1
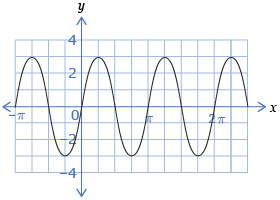
- Determine the amplitude of the following graph. Answer
- Draw a cosine graph with an amplitude of 5. Answer

iStockphoto/Thinkstock
In Try This 2 you looked at the general shape of a cosine function and focused on some of the cosine’s vertical characteristics. You will next look at some of the horizontal characteristics of the graphs of sine and cosine functions.
Try This 3
- Use Unit Circle to Graph to plot the sine and cosine function.
- How do your graphs from Try This 1 and Try This 2 compare to these graphs?
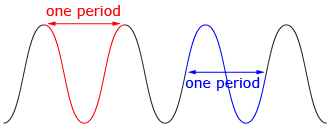
- Turn on only the sine function. As the value of θ increases, the graph begins to repeat itself in a regular manner. A function that repeats itself in this way is called a periodic function. The period of a function is the horizontal length of one cycle on a periodic graph. What is the period of the graph y = sin θ in radians and degrees?
- What are the θ-intercepts, or zeros, of y = sin θ?
- What is the period of the graph y = cos θ in radians and degrees?
- What are the θ-intercepts, or zeros, of y = cos θ?
![]() Save your responses in your course folder.
Save your responses in your course folder.