Discover
Try This 1
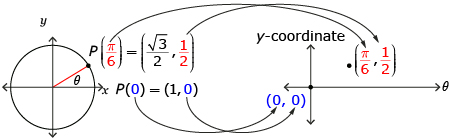
Take out the unit circle you made in Lesson 3: Try This 4. You were able to use this diagram to visualize angles and determine some trigonometric ratios. Another way to visualize some of the same information is to plot a graph of the y-coordinate of the intersection of the terminal arm and the unit circle, P(x, y), versus the angle θ of the terminal arm. Consider these examples:
- When θ = 0, the y-coordinate of P is 0, so the point (0, 0) is plotted. (shown as blue in diagram)
- When
 the y-coordinate of P is
  so the point
  is plotted. (shown as red in diagram)
Open Table and Graph Template.
- Complete the table for all angles on the unit circle you produced in Lesson 3: Try This 4.
- Graph the angle θ against the y-coordinate using the labelled axis provided.
![]() Save your completed copy of Table and Graph Template in your course folder.
Save your completed copy of Table and Graph Template in your course folder.
Share 1
With a partner or group, discuss the following questions based on your graph created in Try This 1.
- What is the shape of the graph you produced?
- Could you extend this pattern for angles larger than 2π? If so, predict the shape of the graph.
- Could you extend this pattern for angles less than 0? If so, predict the shape of the graph.
![]() If required, place a record of your discussion in your course folder.
If required, place a record of your discussion in your course folder.