Lesson 6: Graphing and Transforming Sine and Cosine Functions 1
Focus
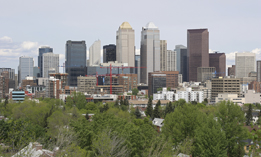
iStockphoto/Thinkstock
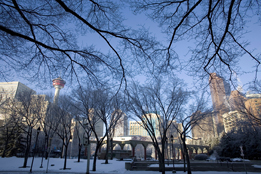
iStockphoto/Thinkstock
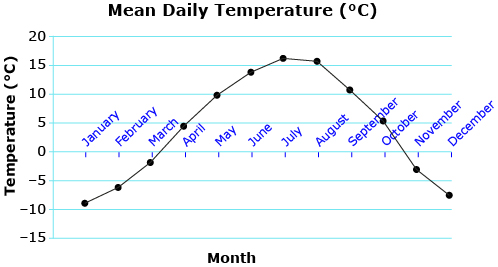
Many natural phenomena are cyclical; they repeat the same pattern over and over. Consider the mean daily temperature in Calgary. You expect warmer temperatures in the summer and then cooler temperatures in the winter, and the cycle repeats. Temperature versus time can be plotted for many years. How would you describe the shape of the graph that follows? What are the domain and range of the graph, and what do the domain and range represent?
|
 |
||||||||||||||||||||||||||||
In this lesson you will learn the general shape of a sine and cosine function and how these functions are related to the unit circle. You will also discover the relationship between the equation of a sine or cosine function and the period and amplitude of each function.
Lesson Outcomes
At the end of this lesson you will be able to
- sketch the graph of functions of the form y = a sin(bx) and y = a cos(bx)
- determine the amplitude, period, domain, and range of a sine or cosine function
- explain how the values of a and b affect the graphs of y = a sin(bx) and y = a cos(bx)
- determine the values of a and b given the graph of a function of the form y = a sin(bx) and y = a cos(bx)
Lesson Questions
You will investigate the following questions:
- How can the functions y = sin x and y = cos x be represented graphically?
- How do the parameters a and b of a trigonometric function affect the shape of the corresponding graph?
Assessment
Your assessment may be based on a combination of the following tasks:
- completion of the Lesson 6 Assignment (Download the Lesson 6 Assignment and save it in your course folder now.)
- course folder submissions from Try This and Share activities
- additions to Glossary Terms and Formula Sheet