Graphic Design Using Polynomials
Project Overview
Purpose
You will be relating and explaining the concepts from Module 3 to curve and contour designs.
Process
Towards the end of the lessons, under Project Connection, you may be prompted to complete a part of the Module 3 Project.
Make sure to save all work from each Project Connection in your course folder. You will submit your entire Module 3 Project to your teacher at the end of Module 3. Check with your teacher about how you should submit your project work before you begin the project.
Presentation
The most important part of your project presentation is clearly explaining and supporting your reasoning with relevant visuals and calculations. Make sure to show all your work.
Carefully check the Module 3 Project Rubric to be sure you are clear about the expectations for the project.
You can choose any format you prefer for the final presentation of this project. Some options include a written document, a virtual or real poster, a website, a video, an oral report, or a slideshow presentation.
Project Introduction
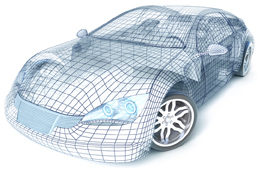
Graphic design is a creative process that combines art and technology to communicate ideas to a particular audience. Imagine the smooth curves of modern cars and the precision that must be involved in designing and creating these curves from metal or plastic materials.
Bezier curves were designed as a tool based on mathematical curves. Bezier curves are used in drawing programs like Adobe Illustrator. Bezier curves are useful in graphic design because they can be scaled indefinitely, allowing them to model smooth curves of any shape. The Bezier curve, in a simple form, is a cubic polynomial. Pierre Bezier developed the curve for the car manufacturing corporation Renault in the 1960s.
 |
iStockphoto/Thinkstock |
Part 1
Polynomials are evident in many places in your environment—to find them, just observe your surroundings with an awareness of graphs of polynomial functions. Such observations can often provide inspiration for graphic artists as they work on creative designs.
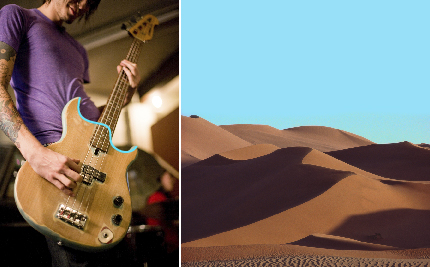
adapted from Photos.com/Thinkstock; dunes: Stockbyte/Thinkstock
Step 1: Select a picture that clearly illustrates a polynomial function. Your picture might be a scene from nature (mountains, clouds, lakes, and so on), a consumer product (cars, clothes, furniture, and so one), or an abstract design. If the photo you choose is not your own, make sure the image is free of copyright restrictions.
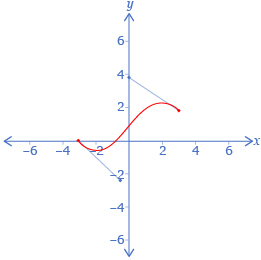
Step 2: Clearly trace over the part of the picture that can be represented as a polynomial function.
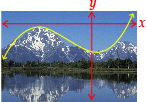
Step 3: Draw x- and y-axes on the picture so that your curve crosses the x-axis at least twice.
Correct and incorrect examples are shown.
Correct
|
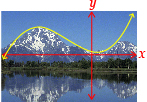
Incorrect
|
Incorrect
|
adapted from Stockbyte/Thinkstock
- State the following characteristics of a polynomial function that could be used to create your curve:
- degree (odd or even)
- the sign of the leading coefficient
- the minimum possible degree
For each characteristic, give a mathematical justification.
Part 2
This part of the project is similar to the first. You will select a picture where a polynomial function can be used to model part of the image; then you will factor the corresponding polynomial function.
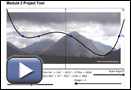
Open Module 3 Project Tool.
![]() Matt Preston/449420240/Flickr
Matt Preston/449420240/Flickr
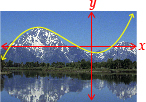
Step 1: Use the Image slider to select an image that you would like to work with.
Step 2: Try to get the black curve as close as possible to a contour in the picture. Do this by dragging the blue points (left and right only) and using the Stretch slider to change the vertical stretch factor. You can also drag the picture around to help match the contour of the black curve.
Step 3: Use the Left Edge and Right Edge sliders to isolate the part of the curve that matches the contour in the image.
Step 4: Take a screen capture showing the picture, curve, and function. (This must be included in your project submission.)
Step 5: Use your knowledge of factoring polynomials to fully factor your polynomial function, including all steps and mathematical justifications. ![]()
Answer the following questions:
- How do the blue points relate to your factors?
- The blue points can only be moved to specific places on the x-axis. Why do you think this is? If the points could be moved to any point on the x-axis, what would happen to the factors of the polynomial?
- How did you determine which binomials (of the form x − a) to test?
Conclusion
Write a brief conclusion to your Module 3 Project. Include a personal reflection of what you feel you learned from the project during and after completion. Be sure to explain why you felt the way you did.
Project Assessment
Your Module 3 Project will be evaluated by your teacher using the evaluation guidelines in the project rubric. Read the rubric carefully. Make sure you are aware of how you will be assessed. You can print or save a digital copy of the Module 3 Project Rubric as a guide to help you complete your project.
Don’t forget to submit your completed Module 3 Project to your teacher at the end of Module 3.