Try This 2
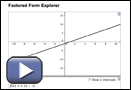
Use Factored Form Explorer to look for relationships between the parameters (a, b, c, d, and e) and the x-intercepts in the graphs. When the applet starts, a first-degree function is shown. Change the a and b sliders, paying attention to how the graph changes. You may want to click the Show x-intercepts box to see more information.
Repeat for functions of degree 2, 3, 4, and 5. You may want to use a table like the one shown to organize your results.
| Degree | Type of Function | Observations |
| 1 | linear | |
| 2 | quadratic | |
| 3 | cubic | |
| 4 | quartic | |
| 5 | quintic |
![]() Save your responses in your course folder.
Save your responses in your course folder.
Share 2
With a partner or in a group, share your observations from Try This 2. As part of your discussion, consider the following questions:
- How do the parameters in the functions (a, b, c, d, e, and f) relate to the x-intercepts of the corresponding graph?
- Is there an algebraic reason for your observation in question 1?
![]() If required, save a summary of your discussion in your course folder.
If required, save a summary of your discussion in your course folder.