Discover
When sketching polynomial functions, one of the characteristics of interest is the behaviour of f(x) (the y-coordinates) as x approaches infinity or negative infinity. This is called end behaviour. Consider the following graph:
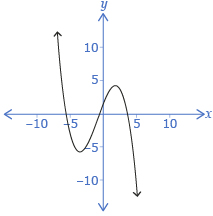
As x approaches −∞, the y-coordinates approach ∞. As x approaches ∞, the y-coordinates approach −∞. Another way to describe this is to think of the graph as “starting” in negative x-values and “ending” in positive x-values. So, you would say that this graph starts in quadrant 2 and ends in quadrant 4.
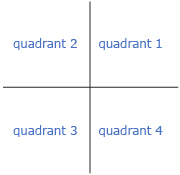
Recall how quadrants on the Cartesian plane are numbered.
Try This 1
Step 1: Use End Behaviour Explorer to look for patterns in end behaviour. When the applet starts, a first-degree (linear) function is shown. Change the a and b sliders, paying attention to how the end behaviour of the function changes.
The degree of a polynomial is equal to the highest exponent of the variable.
Step 2: Repeat for functions of degree 2, 3, 4, and 5.
Step 3: You may choose to create a chart to record and organize your observations.
- Which slider(s) affects the end behaviour of the graphs?

- Describe how the degree of the polynomial and the slider(s) identified in question 1 affects the end behaviour of the graphs.
![]() Save your responses in your course folder.
Save your responses in your course folder.
Share 1
With a partner or in a group, discuss and summarize in a paragraph how the different parts of the polynomial can be used to predict end behaviour.
![]() If required, save a record of your discussion in your course folder.
If required, save a record of your discussion in your course folder.