Module 2: Lesson 2
Self-Check 3
- Questions 8.a. and 8.c. and question 11 on page 87
-
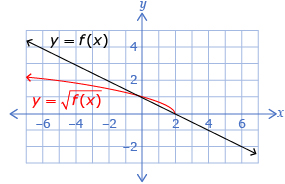
The graph can be split up into four regions:
- When x > 2, the square root graph will be undefined.
- When 0 < x < 2, the y-value of the graph of the square root function will be greater than the y-value of the original graph.
- When x < 0, the y-value of the graph of the square root function will be less than the y-value of the original graph.
- When x = −2 and x = 0, the two graphs have the same y-value (they are invariant points).
This should result in a graph similar to the following one:
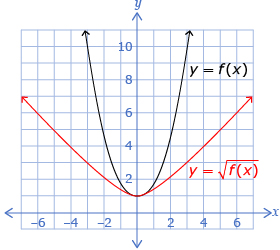
In graphs of square root functions, the domains of the square root functions are restricted. Any portion of the original graph that lies below the x-axis will not appear in the square root graph. In this case, however, there are no circumstances where y < 0. There is a minimum on the range in the original function. Because this minimum is above the y-axis, the new minimum will be the square root of 1. As a result, note the graph of

-
-
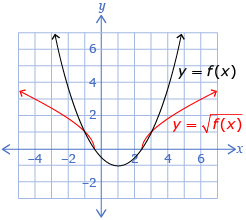
The graph can be split up into four regions:
- When −0.41 < x < 2.41, the graph of the square root function will be undefined.
- When −1 < x < −0.41 and when 2.41 < x < 3, the y-value of the square root graph will be greater than the y-value of the original graph.
- When x < −1 and when x > 3, the y-value of the square root graph will be less than the y-value of the original graph.
- When x = −1 and x = 3, the two graphs have the same y-value (they are invariant points).
This should result in a graph that looks as follows:
- Based on how previous questions have been solved, you should know that the graph of the original function will have the following domain and range:
Domain: {x|x ∈ R} Range:
{y|y ≥ −1, y ∈ R}
In graphs of square root functions, the domains are restricted. Any portion of the original graph that lies below the x-axis will not appear in the square root graph. In this case, that portion occurs when −0.41 < x < 2.41. As a result, for
Domain: {x|x ≤ −0.41, and x ≥ 2.41, x ∈ R}
The minimum value of the original function is below the y-axis. This is the range of the square root function:
Range:
{y|y ≥ 0, y ∈ R}
-
© 2012 Alberta Education