During Try This 1 and Try This 2, you began to notice patterns between the graphs of y = f(x) and ![]() Do these patterns help you graph the square root of any function?
Do these patterns help you graph the square root of any function?
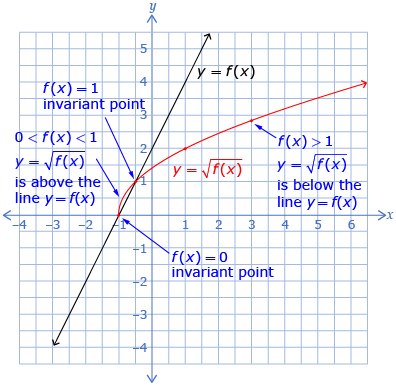
Your chart from Try This 2, which summarizes the patterns between the graphs of y = f(x) and ![]() , may or may not look similar to the following chart. However, the patterns should be similar. This chart arranges the patterns by the value of the original function, y = f(x), and the effect on the graph of the square root of the function,
, may or may not look similar to the following chart. However, the patterns should be similar. This chart arranges the patterns by the value of the original function, y = f(x), and the effect on the graph of the square root of the function, ![]()
| f(x) | f(x) < 0 | f(x) = 0 | 0 < f(x) < 1 | f(x) = 1 | f(x) > 1 |
Note: Take the square root of the y-values of y = f(x), and the range must be positive. |
Based on the patterns you have seen throughout Lesson 2, you will see how to graph ![]() when given the graph y = f(x). Go to Graphing the Square Root of a Function.
when given the graph y = f(x). Go to Graphing the Square Root of a Function.