Module 2: Lesson 1
Self-Check 5
“Your Turn” on page 71
- The transformations that can be used to produce the function
 from the function
  are
are
- a vertical stretch by a factor of 20 about the x-axis
- a vertical translation up 1000 units
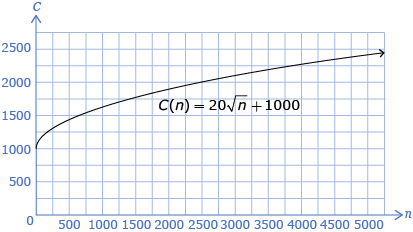
The point (0, 1000) indicates that the minimum cost of production is $1000. The graph also shows that as the number of items being produced increases, the cost per unit will decrease.- The domain is {x|x ≥ 0, x ∈ R}. The range is {y|y ≥ 1000, y ∈ R}. In the context of this question, the domain tells you that the number of items being produced must be greater than or equal to zero. The range tells you that the minimum cost to produce any items is $1000.
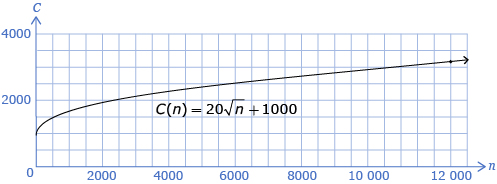
By using the graph to estimate the approximate cost, it will cost about $3200 to produce 12 000 items. The estimated cost from the equation is shown:
© 2012 Alberta Education