Discover
Try This 1
Look at the function y = f(x). Recall that y = f(x) can be thought of as a rule relating how y is determined from x. Can you think of a way to express a rule, x = g(y), relating how x can be determined from y? Complete the following questions to explore this idea.
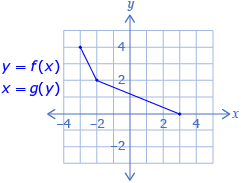
- Use the diagram of y = f(x) to complete a table like the following.

(input, output) for y = f(x) (input, output) for x = g(y) (−3, 4) - Use the (input, output) coordinates from f and g to sketch both on the same coordinate grid. You may use Grid Paper Template to complete this question.
- Determine the domain and range of each relation. How do the domain and range of y = f(x) compare to the domain and range of x = g(y)?
- What visual relationship is there between the graphs of y = f(x) and y = g(x)? Use Reflections and Inverses to determine the line that y = f(x) is reflected across to produce the graph of y = g(x).
![]() Save your work in your course folder.
Save your work in your course folder.